


Abstract
The recent Danish Multicentre Randomized Trial on Single-Lead Atrial (AAIR) Pacing versus Dual-Chamber (DDDR) Pacing in Sick Sinus Syndrome (DANPACE) suggested DDDR pacing as standard care. However, previous findings supported the routine use of AAIR pacing. This study investigated the cost-effectiveness of DDDR pacing compared with AAIR pacing for sick sinus syndrome.
A decision-analytical model based on patient-level data from three randomized trials was designed from the Danish healthcare system's perspective. The main outcomes were lifetime costs, quality-adjusted lifeyears (QALYs), and net monetary benefit. Quality-adjusted lifeyears were calculated by utilizing community-based preferences. Costs were calculated by utilizing the extensive data on resource consumption, from the DANPACE trial. Data were pooled and adjusted for baseline differences. Dual-chamber pacing was shown to be cost-effective in all the analyses using a willingness-to-pay (WTP) threshold of £20 000/QALY, and most analyses using a WTP of £30 000/QALY. When pooling the data and adjusting for baseline differences, Monte Carlo simulations revealed a 51–71% probability of DDDR pacing being cost-effective at a WTP of £20 000/QALY, and a 42–58% probability at a WTP of £30 000/QALY. Dual-chamber pacing was most likely to be cost-effective among elderly patients with comorbidity. The expected value of perfect information was low and initiation of additional publicly funded Danish trials was discouraged.
Dual-chamber pacing is likely to be a cost-effective treatment for sick sinus syndrome patients.
Implanting the more expensive dual-chamber pacemaker device in sick sinus syndrome patients, instead of the cheaper single-lead atrial pacemaker device, will result in cost-savings.
The meta-analysis of individual patient-level data from three randomized controlled trials suggested that sick sinus syndrome patients treated with dual-chamber pacemaker might suffer a slight reduction in quality-adjusted lifeyears, compared with patients treated with single-lead atrial pacing.
Dual-chamber pacing is likely to be a cost-effective treatment for patients suffering from sick sinus syndrome.
Introduction
The Danish Multicentre Randomized Trial on Single-Lead Atrial Pacing (AAIR) versus Dual-Chamber Pacing (DDDR) in Sick Sinus Syndrome (SSS) (DANPACE) showed a statistically significant decrease in reoperations and paroxysmal atrial fibrillation for the DDDR pacing mode.1–3 Therefore, DDDR pacing is now recommended as the standard treatment option in Denmark. However, no studies have reported a comparison of the resource consumption for AAIR pacing vs. DDDR pacing. From a health economic point of view, the choice of DDDR as the recommended treatment option for SSS patients could be controversial: Although DDDR pacing reduces the costs of reoperations,1 the DDDR device costs are higher.4 To decide which pacing mode should be implemented as standard care, and whether or not a new randomized controlled trial should be initiated, a decision analysis based on the existing evidence should be performed.5 The information needed for decision-makers' the choice of standard care should include a comprehensive health economic evaluation, including the combined clinical evidence.6 This study presents such a comprehensive cost–utility analysis, based on pooled patient-level data from three randomized controlled trials, comparing DDDR pacing with AAIR pacing for SSS patients with preserved atrioventricular conduction.
Methods
Overview
To estimate the mean lifetime costs and effects of the two treatment options, a Markov model was developed. As heart failure is not associated with pacing mode,7 the model reflects the two major issues in the treatment of SSS patients: the occurrence of stroke and death, see Figure 1. Patients without a history of stroke entered the model in the health state ‘Well’, and patients with a history of stroke entered in the health state ‘First Stroke’. The model allowed for patients to experience as many as seven strokes. All the models ran monthly cycles and continued for 60 years to ensure that all the relevant costs and outcomes were captured. The analysis was performed from a Danish healthcare system's perspective. The costs were calculated in Danish Kroner at 2012 prices, but converted to Pound Sterling (£) by using an exchange rate of 8.73 Danish Kroner = £1, as per 3 June 2013. Treatment effect was expressed as quality-adjusted lifeyears (QALYs), i.e. lifeyears gained, weighted by the quality of those years. Costs and QALYs were discounted at an annual rate of 3.5%.8
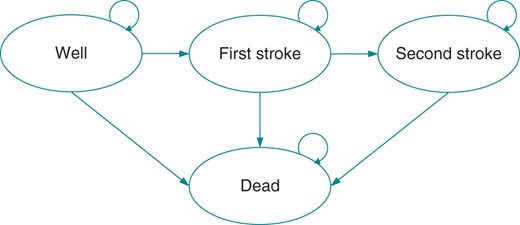
The structure of the Markov model used to estimate lifetime cost-effectiveness.
Data sources
The DANPACE trial collected more than 6100 years of follow-up regarding resource consumption, which was utilized to calculate the costs.1 Data on clinical effectiveness from the DANPACE trial were pooled with two previous Danish randomized trials comparing the pacing modes in SSS patients with the preserved atrioventricular conduction. In the first trial, 225 consecutive patients were randomized to AAI pacing (n = 110) or single-lead ventricular pacing (n = 115).9,10 As single-lead ventricular pacing is not a relevant comparator,11 this comparator was excluded from the present study. In the second trial, 177 consecutive patients were randomized to AAIR pacing (n = 54), DDDR pacing with a rate-adaptive atrioventricular delay of ≤150 ms (n = 60), and DDDR pacing with a fixed long atrioventricular delay of 300 ms (n = 63).12 The baseline characteristics for the pooled data are shown in Table 1, while individual study characteristics are found elsewhere.1,10,12
Pre-operative characteristics for the pooled data
| Characteristic | AAI (n = 871) | DDDR (n = 831) | P value |
|---|---|---|---|
| Female gender, n (%) | 576 (66.1) | 514 (61.9) | 0.07 |
| Age, mean (SD) | 73.9 (10.8) | 72.7 (11.1) | 0.03 |
| Prior history of atrial fibrillation, n (%) | 373 (42.8) | 392 (47.2) | 0.07 |
| Systolic blood pressure (mmHg), mean (SD) | 143.7 (23.7) | 142.3 (22.6) | 0.22 |
| Diastolic blood pressure (mmHg), mean (SD) | 76.0 (12.3) | 76.4 (12.5) | 0.53 |
| Previous myocardial infarction, n (%) | 116 (13.3) | 110 (13.2) | 0.96 |
| Diabetes, n (%) | 75 (9.9) | 85 (10.2) | 0.80 |
| Previous transient cerebral ischaemia, n (%) | 45 (5.2) | 42 (5.0) | 0.92 |
| Previous stroke, n (%) | 70 (8.0) | 71 (8.5) | 0.70 |
| Medication at randomization, n (%) | |||
| Anticoagulation | 119 (13.7) | 105 (12.7) | 0.54 |
| Aspirin | 452 (51.9) | 437 (52.7) | 0.76 |
| Any beta-blocker | 217 (24.9) | 204 (24.6) | 0.86 |
| Calcium-channel blocker | 164 (18.8) | 160 (19.3) | 0.82 |
| Digoxin | 106 (12.2) | 82 (9.9) | 0.13 |
| NYHA functional classification, n (%) | 0.50 | ||
| I | 614 (70.8) | 606 (73.1) | |
| II | 214 (24.7) | 194 (23.4) | |
| III | 38 (4.4) | 27 (3.3) | |
| IV | 1 (0.1) | 2 (0.2) | |
| Wenckebach block point ≥100 b.p.m., n (%) | 769 (94.9) | 690 (91.9) | 0.01 |
The data were not complete for the following parameters: NYHA class (AAI: n = 867, DDDR: n = 829), systolic blood pressure (AAI: n = 856, DDDR: n = 818), diastolic blood pressure (AAI: n = 856, DDDR: n = 817), diabetes (AAI: n = 761, DDDR: n = 831), Wenckebach block point ≥100 b.p.m. (AAI: n = 810, DDDR: n = 751) and following medication: anticoagulation, aspirin, and calcium-channel blocker (AAI: n = 871, DDDR: n = 830).
Costs
The cost of initial pacemaker implantation was calculated from the trial information on resource consumption during surgery, occurrence of complications (e.g. reoperations), and duration of index hospitalization. For each follow-up year, we calculated the costs incurred at a patient-level. The model assumes that all the surviving patients attend follow-up visits at the outpatient clinic with a mean [standard error (SE)] unit cost of £101 (10),13 at 3 months, 2 years, 4 years, and every following year as this is the standard procedure at Aalborg University Hospital, Denmark. Occurrence of stroke and death were priced at £13 348 (1335) and £1314 (131), respectively.13
Effectiveness
The simplicity of the Markov model enabled us to estimate patients' utility by using community-based preferences.14 By assigning a utility value to the health states in the model and accumulating the time spent in these states, total QALYs were calculated. For the health state ‘Well’ in Risk Groups 2–3, a mean (SE) utility of 0.83 (3.6 × 10⁻³) was used.15 The utility decrements used to value the remaining health states are presented in Table 2.
Utility decrements used in the model14
| Health state | Utility decrement Mean (SE) |
|---|---|
| Well in Risk Group 1 | 0.117 (SE 1.38 × 10⁻²) |
| Stroke in Risk Group 1 | 0.223 (SE 1.85 × 10⁻²) |
| Stroke in Risk Groups 2 and 3 | 0.162 (SE 1.47 × 10⁻²) |
| Male gender | 6.75 × 10⁻⁴ (SE 4.64 × 10⁻⁴) |
| Additional year beyond 73 years | −2.90 × 10⁻⁴ (SE 1.54 × 10⁻⁴) |
Analyses
The expected costs and the QALYs were used to estimate the cost-effectiveness of DDDR pacing. The cost-effectiveness results are presented as the net monetary benefit.6 A net monetary benefit larger than zero indicates that DDDR pacing is a cost-effective strategy at the chosen willingness-to-pay (WTP) threshold. As recommended, by the National Institute for Health and Excellence in the UK, WTP thresholds of £20 000/QALY and 30 000/QALY were used.8 Cost-effectiveness estimates were obtained by using: (i) an unadjusted approach with data drawn from DANPACE; and (ii) an adjusted approach with data drawn from DANPACE; and (iii) an adjusted pooled approach with data from all the three studies. Adjustments were performed because the SSS patients constitute a heterogeneous group, e.g. patients' pre-operative age ranged from 24 to 99 years in the DANPACE trial. This may affect both the likelihood of transitions and the costs incurred, and must therefore be addressed in the analyses of the model to avoid confounding, also called heterogeneity bias in health economic evaluations.16
Risk groups
The issue of heterogeneity bias was addressed in the present study by dividing the patients into three risk groups based on their predicted probability of survival. By using a Cox proportional hazard model, the characteristics of the three risk groups were estimated: ‘Risk Group 1’ were defined as the characteristics of the quartile of patients with the highest probability of death; ‘Risk Group 3’ defined as the characteristics of the quartile of patients with the lowest probability of death; and ‘Risk Group 2’ were the characteristics of the patients in-between. The defined characteristics of Risk Groups 1–3 are shown in Table 3.
Risk group characteristics
| Covariate | Risk Group 1 | Risk Group 2 | Risk Group 3 |
|---|---|---|---|
| Age, years | 81 | 74 | 63 |
| Female gender | Yes | No | No |
| Previous myocardial infarction | Yes | No | No |
| Prior history of atrial fibrillation | Yes | Yes | No |
| Proportion starting in ‘First Stroke’ | 13% | 7% | 6% |
Sensitivity analyses
Probabilistic sensitivity analyses were performed to test the robustness of the cost-effectiveness results. The probabilistic sensitivity analyses were performed by drawing 10 000 trial simulations. For the probabilistic models, the costs and the utility decrements were drawn from the gamma distributions, and the hazard ratios were drawn from the lognormal distributions. Cholesky's decomposition was applied to account for the correlation between the parameters of all the regression analyses.17
The simulation results were utilized for estimating the probability of DDDR pacing being cost-effective and the expected value of perfect information (EVPI). Expected value of perfect information estimation is based on the assumption that making decisions based on the existing information are associated with uncertainty and a wrong decision will incur a cost, in terms of health benefits and resources forgone.18 The EVPI represents the maximum value of additional research, and if the cost of this additional research exceeds the EVPI, it should not be initiated.4,18,19
Statistical analyses
The annual costs incurred in health states were determined by fitting generalized linear regression models with the per-year costs as the dependent variable. The costs regressions were fitted by using a gamma family distribution and a log link, and were adjusted for clustering by patient id. Two cost models were fitted: (i) an unadjusted cost-model with treatment group as the only covariate; and (ii) an adjusted cost-model which included treatment group, prior history of atrial fibrillation, previous stroke, previous myocardial infarction, female gender, and age as covariates. In the decision-analytical models, the unadjusted cost-model was used to determine the cost per cycle for the model by using an unadjusted approach, and the adjusted cost-model was used to determine the cost per cycle for Risk Groups 1–3 in both the adjusted approach and the pooled adjusted approach.
The detailed information on the time-to-event was used to estimate all transition probabilities. This was done by constructing three semi-parametric multi-state models. The multi-state models were fitted as Cox proportional hazards, where all the baseline hazards were assumed to be unrelated, i.e. the models were stratified on the transitions.20 The characteristics of each risk group were entered as the values of the transition-specific covariates to estimate the transition probabilities for a particular risk group. Second-order polynomials were fitted and their formulae were utilized to extrapolate lifetime transition probabilities for each risk group. The incidence of stroke was not allowed to increase after the last observed event. The risk of additional strokes was modelled from the risk of having a second stroke. Similarly, the probability of death after the first stroke was also used after two or multiple strokes. The adjusted multi-state models included treatment group, prior history of atrial fibrillation, previous stroke, previous myocardial infarction, female gender, and age, as transition-specific covariates.
Data were analysed by the intention-to-treat principle. The baseline characteristics were compared by using Student's t-test for normally distributed continuous data, Mann–Whitney' U test for non-normally distributed continuous data, and Pearson's χ2 test for categorical data. Confidence intervals for the difference in resources consumed were estimated by drawing 5000 bootstrap resamples.21 Statistical analyses were performed by using R version 2.15.1 (General Public License software) and Stata version 12.1 (StataCorp). The decision-analytical model was developed in Microsoft Excel 2010 (Microsoft Corporation).
Results
The mean (SE) cost of the initial pacemaker implantation was £6304 (85) for the AAIR group and £5661 (97) for the DDDR group. The annual cost for each treatment group was estimated from the data on consumption of resources collected alongside the DANPACE trial, see Table 4. Estimates of lifetime costs and QALYs were combined to calculate the net monetary benefit of DDDR pacing. In all the scenarios, DDDR pacing was likely to be cost-effective at a WTP of £20 000/QALY, see Table 5. When applying a WTP of £30 000/QALY, DDDR pacing remained cost-effective, except in Risk Group 2 of the adjusted pooled approach. The probabilistic sensitivity analysis of the pooled adjusted approach showed that DDDR pacing had a 51–71% probability of being cost-effective at a WTP of £20 000/QALY. The probability of DDDR pacing being cost-effective was reduced to 42–58% when increasing the WTP to £30 000/QALY in the pooled adjusted approach. The decision-analytical models using the adjusted approaches showed a likely trade-off between the costs and the QALYs. In other words, DDDR pacing provided a reduction in cost, which sufficiently compensated for the loss of the QALYs. The Markov trace for Risk Group 2 by using the adjusted approach is presented in Figure 2.
Annual resources consumed per patient after pacemaker implantation in the DANPACE trial
| Resource type | DDDR | AAIR | Difference | Unit cost (source) |
|---|---|---|---|---|
| Mean | Mean | Mean difference (95% CI) | Mean in DDDR/AAIR | |
| Pacemaker reoperations | 2.63 × 10⁻² | 5.10 × 10⁻² | −2.48 × 10⁻² (−3.46 × 10⁻²; −1.44 × 10⁻²) | £4692/£5078(Micro costing) |
| Pulmonary embolisms | 9.85 × 10⁻⁴ | 1.29 × 10⁻³ | −3.07 × 10⁻⁴ (−1.97 × 10⁻³; 1.95 × 10⁻³) | £454913 |
| Peripheral embolisms | 6.57 × 10⁻⁴ | 3.23 × 10⁻⁴ | 3.34 × 10⁻⁴ (−6.50 × 10⁻⁴; 1.64 × 10⁻³) | £273613 |
| Myocardial infarctions | 6.57 × 10⁻³ | 6.14 × 10⁻³ | 4.31 × 10⁻⁴ (−3.81 × 10⁻³; 4.94 × 10⁻³) | £659313 |
| Hospital admissions for | ||||
| Post-implantation care | 2.79 × 10⁻² | 2.75 × 10⁻² | 4.60 × 10⁻⁴ (8.32 × 10⁻³; 9.66 × 10⁻³) | £2000/£182113 |
| Arrhythmia | 7.16 × 10⁻² | 7.62 × 10⁻² | −4.63 × 10⁻³ (−2.53 × 10⁻²; 1.49 × 10⁻²) | £2805/£270813 |
| Syncope | 1.44 × 10⁻² | 2.00 × 10⁻² | −5.58 × 10⁻³ (−1.30 × 10⁻²; 1.71 × 10⁻³) | £1700/£171913 |
| Heart failure | 1.31 × 10⁻² | 2.16 × 10⁻² | −8.50 × 10⁻³ (−2.13 × 10⁻²; 1.27 × 10⁻³) | £3933/£377613 |
| Transient ischaemic attack | 4.60 × 10⁻³ | 3.88 × 10⁻³ | 7.22 × 10⁻⁴ (−2.66 × 10⁻³; 4.14 × 10⁻³) | £3616/£212313 |
| Sequelae of cardiac eventa | 8.54 × 10⁻³ | 9.04 × 10⁻³ | −5.05 × 10⁻⁴ (−6.60 × 10⁻³; 5.38 × 10⁻³) | £2871/£337913 |
| Other cardiac related reason | 0.110 | 8.53 × 10⁻² | 2.47 × 10⁻² (1.65 × 10⁻³; 5.01 × 10⁻²) | £1903/£184613 |
| Nursing home, days | 8.92 | 11.2 | −2.26 (−5.11; 0.54) | £12122 |
| Pharmaceuticalsb, £ | 182 | 191 | −9.10 (−18.02; 0.01) | 23 |
The treatment columns show the annual event rate per patient. Differences in unit costs are attributed to differences in duration of admissions, and for pacemaker reoperations also due to differences in the used utensils.
aAdmissions where cardiac events were suspected as well as admissions due to sequelae from cardiac events.
bPharmaceuticals include: anticoagulants, digoxin, statins, aspirins, diuretics, antidepressants, antipsychotics, antiarrhythmic agents, antihypertensive agents, and combinations of the aforementioned.
Cost-effectiveness results
| Risk Group 1 | Risk Group 2 | Risk Group 3 | |
|---|---|---|---|
| The adjusted approach | |||
| Incremental cost, £ | −3366 | −2570 | −5045 |
| Incremental effectiveness, QALY | −0.022 | −0.029 | −0.041 |
| Net monetary benefit, £ | 2918 (2694) | 1996 (1709) | 4220 (3808) |
| Probability DDDR is cost-effective | 77% (69%) | 60% (55%) | 64% (59%) |
| EVPI per patient, £ | 472 (996) | 1532 (2796) | 2608 (3442) |
| The adjusted pooled approach | |||
| Incremental cost, £ | −4170 | −3856 | −7521 |
| Incremental effectiveness, QALY | −0.103 | −0.170 | −0.218 |
| Net monetary benefit, £ | 2103 (1069) | 460 (−1238) | 3160 (980) |
| Probability DDDR is cost-effective | 71% (58%) | 51% (42%) | 62% (51%) |
| EVPI per patient, £ | 608 (1442) | 2086 (2428) | 1957 (3835) |
| The unadjusted approach | |||
| Incremental cost, £ | −2310 | ||
| Incremental effectiveness, QALY | 0.277 | ||
| Net monetary benefit, £ | 7847 (10 615) | ||
| Probability DDDR is cost-effective | 88% (86%) | ||
| EVPI per patient, £ | 379 (718) | ||
Incremental costs and QALYs are calculated as the expected mean in the dual-chamber pacemaker group minus the excepted mean in the single-lead atrial pacemaker group. Net monetary benefits, probabilities of dual-chamber pacing being cost-effective and expected values of perfect information are calculated by using a WTP threshold of £20 000 (£30 000) per QALY.
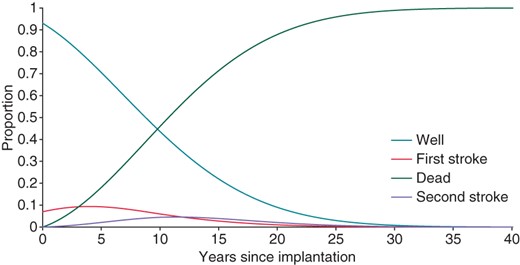
Markov trace showing the AAIR patients flow through the model in Risk Group 2 of the adjusted approach.
Assuming a WTP of £30 000/QALY, the EVPI was £1442–3835. The EVPI was lowest in Risk Group 1 regardless of which data informed the model.
In the unadjusted multi-state model, DDDR pacing marginally reduced the risk of stroke and death, see Table 6. The adjustment for covariates slightly changed this, and DDDR pacing was shown to slightly increase the risk of transitioning from ‘Well’ to ‘Dead’. The imbalance in age between treatment groups was the main reason for the flip, in which the treatment provided a slight risk reduction.
Regression analyses used to inform the decision-analytical models
| Covariate | Unadjusted model | Adjusted model | ||||
|---|---|---|---|---|---|---|
| Coefficient | Robust SE | Coefficient | Robust SE | |||
| Costs regressions | ||||||
| DDDR treatment | −0.184 | 0.130 | −0.141 | 0.107 | ||
| Prior history of atrial fibrillation | 0.050 | 0.106 | ||||
| Female gender | 0.175 | 0.107 | ||||
| Previous stroke | 0.762 | 0.158 | ||||
| Previous myocardial infarction | 0.423 | 0.142 | ||||
| Age above 63 years | 2.42 × 10⁻² | 6.47 × 10⁻³ | ||||
| Age above 63 years squared | 1.06 × 10⁻³ | 2.82 × 10⁻⁴ | ||||
| Constant | 9.985 | 0.088 | 8.903 | 0.111 | ||
| Unadjusted model | Adjusted modela | Adjusted pooled modela | ||||
| Hazard ratio | SE | Hazard ratio | SE | Hazard ratio | SE | |
| Cox proportional hazard multi-state models | ||||||
| Transition from Well to First Stroke | ||||||
| DDDR treatment | 0.94 | 0.250 | 0.95 | 0.251 | 0.96 | 0.218 |
| Transition from Well to Dead | ||||||
| DDDR treatment | 0.93 | 0.109 | 1.02 | 0.110 | 1.06 | 0.102 |
| Transition from First Stroke to Second Stroke | ||||||
| DDDR treatment | 0.97 | 0.451 | 0.99 | 0.461 | 1.07 | 0.399 |
| Transition from First Stroke to Dead | ||||||
| DDDR treatment | 0.91 | 0.261 | 0.96 | 0.269 | 1.06 | 0.229 |
aModels were adjusted for covariates: prior history of atrial fibrillation, previous stroke, previous myocardial infarction, female gender, and age.
Discussion
The analyses showed that, DDDR pacing is a cost-effective strategy for treating SSS, as the slight QALY-loss per patient was counterbalanced by the reduction in costs. Analyses showed that the cost-effectiveness of using DDDR pacing in elderly SSS patients, with comorbidity, was more likely than among younger patients, without comorbidity. This can be attributed to a slighter QALY loss among the elderly patients with comorbidity and a larger cost-saving, hailing mainly from a reduction in the costs of nursing home placements and pacemaker reoperations.
The results of this cost-effectiveness analysis of DDDR pacing vs. AAIR pacing for SSS patients contradicts earlier health economic findings.2,24 In a retrospective follow-up study, Clarke et al.22 found that adopting AAI pacing could save £711 per patient. However, the study by Clarke et al. did not estimate the incremental effectiveness. Therefore, formal cost-effectiveness results cannot be drawn from the study. Castelnuovo et al.4 performed a cost–utility analysis by comparing AAIR pacing and DDDR pacing in SSS patients aged 75 years. Similar to our findings, Castelnuovo et al. found that DDDR pacing was associated with a loss of QALYs; 0.04 within 5 years and 0.12 within 10 years. However, Castelnuovo et al. found that DDDR pacing was more costly than AAIR. As such, AAIR pacing was a dominant strategy compared with DDDR pacing in all the analyses. In the 5-year model, DDDR pacing had an approximate 29% probability of being cost-effective at a WTP of £20 000/QALY. There are two main reasons for the differences in the results of the present study and the study by Castelnuovo et al. First, Castelnuovo et al. did not have access to patient-level data on resource consumption to estimate the costs following pacemaker implantation. In the model developed by Castelnuovo et al. Dual-chamber pacing was more expensive in the years following the initial pacemaker implantation; whereas the opposite is true for the model we present. Secondly, Castelnuovo et al. noted that the cost-effectiveness results were primarily based upon the clinical finding of one randomized controlled trial.12 The study which Castelnuovo et al. based their model on showed that AAIR pacing led to a decrease in atrial fibrillation, which in turn decreased the risk of subsequent strokes and death from stroke in their model. On the contrary, the clinical evidence used in the present study showed that DDDR pacing marginally reduced the occurrence of the first stroke.1 This difference between the clinical effectiveness data used for the two health economic evaluations is an important reason for the difference in the cost-effectiveness results. In addition, the present study ran models with a lifetime horizon, whereas Castelnuovo et al. did not.
The DANPACE data on the consumption of healthcare resources showed that DDDR pacing was cost-saving in the years following the initial pacemaker implantation. The cost reduction following the pacemaker implantation was primarily attributed to the reduction in nursing home placements and pacemaker reoperations.1 In a similar study, Goldberger et al.25 compared the costs of implanting dual-chamber implantable cardioverter-defibrillators (ICDs) with single-chamber ICDs. Although the dual-chamber ICD is a more expensive device, it was the least costly option as it obviated the need for upgrades. This supports the claim that implanting the more costly DDDR device will reduce the overall treatment cost.
The unadjusted approach reflects a crude analysis of data, where the possibility of heterogeneity bias is ignored. This analysis showed that DDDR pacing was 88% likely to be cost-effective at a WTP of £20 000/QALY, and a dominant strategy in 59% of the simulations. However, the heterogeneity bias caused a false sense of security, as the probability that DDDR pacing was cost-effective was lower in the adjusted approach. It should therefore be noted that the present study is strengthened by the use of regression-based modelling of the effectiveness and the costs.
Since Denmark only has ∼1000 new cases of SSS per year,26 the EVPI results from the present study indicate that the marginal cost of obtaining further evidence, through another publicly funded Danish trial comparing AAIR and DDDR pacing, is likely to gravely surpass the marginal value of that evidence.
A few limitations to our study are worth noting. First, the present study is limited by the fact that a few potentially relevant resource types were overlooked, e.g. the use of the family physician and additional visits to the outpatient clinic. We argue that the costs of these resource types are an insignificant part of the total annual healthcare costs and that their absence does not pose a threat to the validity. A second potential limitation of the present study is that a set of community-based preference values were utilized to estimate health-related quality of life (HRQoL) because patient-specific data on HRQoL were not collected in the DANPACE trial.14 Although this may decrease the internal validity, it could increase the generalizability of our analyses. Future work should therefore focus on gathering information on the HRQoL of patients treated with AAIR and DDDR pacing to inform the estimation of the QALYs.
Conclusions
The present study showed that DDDR pacing was likely to be a cost-effective strategy compared with AAIR pacing in most analyses. Elderly SSS patients with comorbidity appeared to be an especially cost-effective group to treat with DDDR pacing.
Funding
The DANPACE trial was funded by unrestricted grants from Medtronic, St Jude Medical, Boston Scientific, Ela Medical, Pfizer, and the Danish Heart Foundation (10-04-R78-A2954-22779). The preparation of this manuscript was undertaken independently of the funding for the DANPACE trial.
Acknowledgements
The authors wish to thank biostatistician Anders Gorst-Rasmussen for his valuable feedback regarding the statistical modelling.
Conflict of interest: J.C.N. received speaker's fees from Biotronik and consultant's fee from Medtronic and a research grant for the MANTRA-PAF trial from Biosense-Webster. The other authors report no conflicts.
