


Abstract
Device infection is a serious complication and is considered procedure-related if occurring within 12 months of an intervention. We analysed the effectiveness of a simple infection-control protocol (ICP) at reducing cardiac device infections (CDIs) in a tertiary referral centre.
Prior to the introduction of a new ICP, we retrospectively analysed all simple and complex device implants, related procedures, and infections over a 3-year period. A new protocol was implemented from November 2007, including antibiotic prophylaxis determined by risk stratification, improved glycaemic control, specific skin preparation, and closure techniques, as well as different diathermy settings. Follow-up data for all patients were collected. Risk factors for infection were compared between pre- and post-intervention groups to ensure that the populations were comparable. A cost analysis of CDI and a review of the commonly identified micro-organisms were also undertaken.
One thousand seven hundred and ninety-eight procedures were performed between November 2004 and November 2007 and 981 procedures between November 2007 and May 2009. There were no significant differences in the risk factors for infection between the two groups. Following the introduction of the ICP, there was a 54% reduction in the incidence of CDI from 1.3 to 0.6% (P < 0.03; CI 0.25, 1.36). Most patients with CDI had negative blood cultures or grew Staphylococcus sp. The average cost was £30 958.40 per infection incident and the cost of the new ICP was minimal.
A significant reduction in CDI can be achieved with the introduction of a simple ICP with substantial cost savings.
A significant reduction in cardiac device infections can be achieved with the introduction of a simple infection-control protocol.
A significant reduction in cost was achieved with the introduction of our ICP.
Introduction
Implantable cardiac devices for the treatment of bradycardias and heart failure and the prevention of sudden cardiac death are now being increasingly used1,2 due to demonstrated improved clinical outcomes.3–7 In line with increase in device implantation, cardiac device infection (CDI) rates have also been increased, but at a faster rate.8 Cardiac device infection remains one of the most serious complications following implantation, currently affecting between 1 and 2%9 of patients, with reported rates varying between 0.13 and 12.6%.7,10,11,12,13 In the USA, between 1990 and 1999, CDI in Medicare beneficiaries increased by 124%.14
Cardiac device infection requires prolonged hospitalization, hazardous system extraction, extended antimicrobial treatment, and need for re-implantation. Mortality rates associated with CDI are believed to be between 2.6 and 18%15,16 although some have reported CDI-related deaths to be as high as 18%.12,13,17 Even in patients where infection appears limited to the pocket, treatment warrants lead extraction as these are often involved despite the absence of bacteraemia or positive echocardiographic findings.10 Mortality rates for CDI endocarditis without device extraction range from 31 to 66%.18
Surgical site infection
The Centre for Disease Control (CDC) has developed criteria for defining surgical site infections (SSIs), which have been adopted as a standard for surveillance and data collection.19 It is generally accepted that infections occurring within 1 year of an intervention are related to the operation itself. Cardiac device infection can be classified into primary infections which are usually due to contamination at the time of implant and secondary infections due to bacterial seeding from an alternative source.
Data regarding specific interventions aimed at preventing CDI are lacking. To address these issues we undertook a study to identify the incidence of CDI at our institution and examined the impact of an infection control protocol (ICP) on infections occurring within a year of the last device-related procedure. In addition, we undertook an analysis of the pathogens identified in these patients and the financial impact of CDI.
Methods
Retrospective audit
A retrospective audit of all CDIs in a single tertiary referral institution (Heart Hospital, UCLH National Health Service (NHS) Trust, London, UK) was conducted between October 2004 and October 2007.
All data regarding de novo device implants and device-related procedures performed by 167 skilled operators during the study period were collated. These operators were trained in cardiology, and possessed the Membership of the Royal Colleges of Physicians qualification. All CDIs occurring within a year of the last device-related procedure were identified by a search of the hospital-computerized database and the list was cross referenced with procedural logbooks to ensure complete case identification. This included all patients (n = 6) who initially presented to other hospital trusts across the UK. Microbiology records were systematically analysed and detailed analyses of hospital admissions, including duration of stay, and treatments received were recorded.
A medical record review was performed on all patients who had any device-related procedure. Data were collected on (i) device type [permanent pacemaker (PPM), implantable cardioverter-defibrillator (ICD), biventricular pacemaker (CRT-P), and biventricular ICD (CRT-D); (ii) procedure type (de novo implant, generator change or lead revision); (iii) patient demographics and clinical characteristics; and (iv) patient risk factors such as diabetes, renal disease, anticoagulation, immunosuppression, inflammatory markers at implant, presence of a cardiomyopathy, and presence of a temporary pacing wire.
Infection-control protocol
An ICP devised by a multi-disciplinary team was introduced in November 2007. We assume a 100% compliance rate to the ICP in all procedures after its introduction. The protocol was based on recent evidence and is outlined below:
Methicillin-resistant Staphylococcus Aureus screening
Screening for MRSA carriage was performed on all patients by nasal, groin, and axillary swabs prior to device procedures. Where there was inadequate time to obtain an MRSA result, patients were empirically treated with an eradication regime. If MRSA carriage was detected, topical suppression (nasal mupirocin and 4% chlorhexidine skin wash) were applied for 5 days prior to operation. Teicoplanin and gentamicin were used for antibiotic prophylaxis in this patient group.
Antibiotic cover
For new device implants, flucloxacillin 1 g and gentamicin 1.5 mg/kg were administered intravenously within 30 min of the start of the procedure so that optimal bactericidal concentration of the drugs was achieved at skin incision. Penicillin allergic patients received clarithromycin 500 mg IV and gentamicin 1.5 mg/kg IV.
Patients were identified as high risk for CDI if they were undergoing re-intervention, or had a temporary pacing wire in-situ. Other factors conferring an increased risk included recent infections, prosthetic valves, previous endocarditis or device infections, diabetes, adult congenital heart disease and the presence of cardiomyopathy. This ‘high-risk’ group received teicoplanin 400 mg and gentamicin 1.5 mg/kg intravenously half an hour before skin incision. Patients with renal impairment (creatinine >200) received teicoplanin (800 mg) only.
Antibiotics were not delivered directly into the pocket or continued post-procedure.
Skin preparation
Double gloving was mandatory during draping and outer gloves were removed prior to skin incision. Betadine was replaced by a 2% chlorhexidine gluconate/70% isopropyl alcohol solution in a preloaded applicator.
Hair removal
Hair over the surgical site was only removed using electrical clippers.
Glycaemic control
A serum glucose level of <11 mmol/L (200 mg/dL) to be achieved in all diabetic patients during procedures and post-operatively.
Sutures
Antibacterial-coated vicryl sutures impregnated with triclosan were used for subcutaneous closure.
Surgical scrub
Surgical scrubbing was performed with a recommended scrubbing time of 2 min.
Diathermy
Cutting diathermy at 40 W was used after incision for cutting and haemostasis.
Raised inflammatory markers or fever within 24 h
Patients with clinical signs of sepsis or raised infective markers [fever, leucocytosis (WCC ≥10) or C reactive protein ≥30] had their procedure deferred.
Intravenous access
Closed system intravenous access cannulas were used in all patients, with meticulous attention to sterility before use.
Body temperature control
A Bair Hugger was recommended in all patients who were undergoing complex device implant.
Wound dressings
Wound dressings were left intact for 3 days post procedure. Removal of dressings and bathing that result in soiling over the wound site was discouraged.
Prospective audit
A prospective audit of consecutive device implants and revisions, performed between November 2007 and April 2009, was conducted to explore the impact of the ICP on the incidence of procedure-related infection. The same demographic and procedural data as in the retrospective audit were collected. Infections occurring after 12 months were not considered procedure-related for analysis.
Definitions of infection
We used the definition of CDI defined by other groups17,20 as either local infection of the generator pocket or device-associated infective endocarditis. The latter was confirmed if valvular or lead vegetations were detected on echocardiography, or if the Duke Criteria for endocarditis were met.21
Patients with suspected infection had at least two sets of blood cultures prior to initiation of antimicrobial therapy. This was not possible in all cases as antibiotic treatment had already been initiated in some patients by their primary care practitioner or local hospital. All patients with evidence of a CDI underwent complete system extraction. A gram stain and wound culture were performed on tissue from the generator pocket and lead tips were also sent for culture at the time of extraction. Minor peri-procedural incisional erythema and superficial cellulitis not extending to the pocket, which responded to oral antibiotics, were not classed as CDI.
Cost analysis
Estimates of the cost of CDI were derived from the cost of hospital beds, device extraction, re-implantation, and antimicrobial therapy. The average in-patient cost for hospitalization was 431.59 Great British Pound (GBP) per day per bed. The cost of a critical care bed was GBP853.59 per day, and the cost of a cardiac ward bed was GBP296.52. The local tariff for device extraction was GBP2537 per patient. Re-implantation costs varied depending on device type Antibiotic use cost analysis was performed using the British National Formulary price list.
Statistical methodology
The demographics, procedure types, and risk factors for infection were compared among all patients in the control group and study groups (to ensure that these two populations were comparable for CDI) using Fisher's exact probability test.
Continuous data were summarized using mean and standard deviation (SD) or 95% confidence interval (95% CI) as indicated in the text or in tables. Categorical data: differences in proportions were analysed using the G-test for goodness of fit. Expected infection rates were estimated from the first, pre-protocol phase of the study (intrinsic hypothesis). Confidence intervals for proportions were generated using the method of Agresti and Coull (Agresti & Coull, 1998). Data were analysed using SPSS (SPSS for Windows, SPSS, Inc., Vers. 19.00.01).
Results
Overall device infection rates
Two thousand seven hundred and seventy-nine device implants or device-related procedures were performed between November 2004 and May 2009 (Table 1). In the retrospective study, 1798 device procedures were performed, of which 24 patients (1.33%; 95% CI = 0.89–1.99%) developed infections requiring device removal (Figure 1). Following the implementation of the ICP, 981 procedures were performed and 6 infections required device removal (0.62%; 95% CI = 0.25–1.36%; P = 0.028) (Table 2). Overall, there was a significant reduction in the incidence of recorded infections within a year of the device procedure (1.3–0.6%. P < 0.01) (Table 2).
Procedure breakdown by device type
| PPM (n/%) | ICD (n/%) | CRT (n/%) | |
|---|---|---|---|
| New device | 1108/39.9 | 729/26.2 | 304/10.9 |
| Lead revisiona | 98/3.5 | 78/2.8 | 41/1.5 |
| Generator change | 380/13.7 | 136/4.9 | 20/0.7 |
| Upgrade | – | – | 102/3.7 |
| Pocket revision/other—27 total | |||
| PPM (n/%) | ICD (n/%) | CRT (n/%) | |
|---|---|---|---|
| New device | 1108/39.9 | 729/26.2 | 304/10.9 |
| Lead revisiona | 98/3.5 | 78/2.8 | 41/1.5 |
| Generator change | 380/13.7 | 136/4.9 | 20/0.7 |
| Upgrade | – | – | 102/3.7 |
| Pocket revision/other—27 total | |||
*Table showing breakdown of all procedures over the study period (number and percentage of total procedures).
aThe number of procedures which included lead revisions. Lead revisions were, therefore, not considered a separate procedure.
Infection rates for all device procedures
| Year | Procedure number (n) | Infections (n) | Rate (%) | 95% CI (%) | Reduction in infection rate (P) |
|---|---|---|---|---|---|
| 2004–5 | 643 | 9 | 1.40 | 0.7–2.7 | N/A |
| 2005–6 | 598 | 7 | 1.17 | 0.5–2.5 | N/A |
| 2006–7 | 557 | 8 | 1.44 | 0.7–2.9 | N/A |
| Pre-intervention total | 1798 | 24 | 1.33 | 0.9–2.0 | N/A |
| 2007–8 | 617 | 3 | 0.49 | 0.1–1.5 | 0.041 |
| 2008–9 | 364 | 3 | 0.82 | 0.2–2.5 | 0.370 |
| Post-intervention total | 981 | 6 | 0.62 | 0.3–1.4 | 0.028 |
†Table showing infection rates by year, as well as total pre- and post-intervention rates.
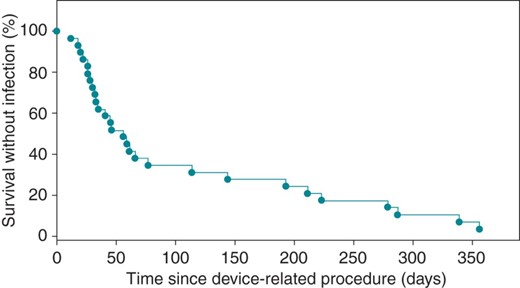
Kaplan–Meier plot—Kaplan–Meier Plot of the time to CDI after device-related procedure (n = 24).
Breakdown of infection rates
The overall infection rate by device type revealed that the ICP significantly reduced the composite of complex single- and dual-chamber ICD and CRT-D infection rates (1.8 vs. 0.77%; P = 0.046) (Table 3). The predominant benefit seen was due to reduction of infection in ICDs (1.89 vs. 0.47%; P = 0.01). Although there was also a trend towards infection reduction in the PPM population, this did not reach statistical significance (0.74 vs. 0.43%; P = 0.43).
Infection rates for ICD and CRT-D devices implanted during the study 2004–9
| Year | Total device implantations | Infections | Rate (%) | 95% CI | G-test |
|---|---|---|---|---|---|
| 2004–5 | 327 | 6 | 1.83 | 0.75–4.04% | |
| 2005–6 | 347 | 5 | 1.44 | 0.52–3.43% | |
| 2006–7 | 324 | 7 | 2.16 | 0.96–4.48% | |
| Pre-intervention total | 998 | 18 | 1.80 | 1.12–2.85% | |
| 2007–8 | 370 | 2 | 0.54 | 0.02–2.08% | |
| 2008–9 | 151 | 2 | 1.32 | 0.06–5.01% | |
| Post-intervention total | 521 | 4 | 0.77 | 0.22–2.03% | P = 0.046 |
‡Infection rates for complex devices (ICD and CRT-D) by year and pre- and post-intervention totals.
Risk factor analysis
Patient demographics and risk factors for infection for both groups of patients are shown in Table 4. Of note, there was a significantly higher incidence of diabetes and renal disease as well as a longer mean procedure time in the post-protocol population.
Risk factor analysis
| Risk factor | Pre-protocol | Post-protocol | P-value |
|---|---|---|---|
| Age (n) | 61.0 | 64.7 | <0.01 |
| Gender (m/f ratio) | 1.8 | 1.8 | 0.9 |
| Diabetes (n/%) | 41/8.1 | 68/14.8 | <0.01 |
| Cardiomyopathy (n/%) | 254/46.7 | 285/37.4 | 0.5 |
| Renal disease (eGFR) (n) | 1.4 | 2.0 | <0.01 |
| Anticoagulation (n/%) | 35/5.4 | 56/11.9 | <0.01 |
| Redo procedure (n/%) | 199/30.9 | 162/35.2 | 0.2 |
| Immunosuppression (n/%) | 4/0.93 | 1/0.22 | 0.3 |
| Re-intervention (n/%) | 14/2.13 | 10/1.98 | 0.3 |
| Procedure duration (min) | 73.1 | 91.9 | <0.01 |
| Temporary wire (n/%) | 33/5.02 | 40/9.03 | 0.07 |
§Risk factor breakdown and comparison between pre- and post-intervention population.
Cost analysis
The mean duration of stay for all patients with device infections was 29.9 (±28.8) days. A total of 220 bed days in critical care and 688 cardiac ward bed days were occupied. Bed occupancy alone totalled 391 795.56 GBP for all CDI patients, while procedural costs for device extraction totalled 76 110 GBP. 442 553.22 GBP was spent replacing devices and 18 293.12 GBP was spent on antibiotics (Table 5).
Cost of CDI by device type
| Device type | Device cost (average GBP) | Implantation cost (GBP) | Total procedure cost (GBP) | Number of procedures (n) | Total cost (GBP) |
|---|---|---|---|---|---|
| PPM | 1682.18 | 372.30 | 2738.62 | 8 | 21 908.96 |
| ICD | 13 377.16 | 415.17 | 18 385.18 | 16 | 294 162.88 |
| CRT-D | 15 329.78 | 484.35 | 21 080.23 | 6 | 126 481.38 |
¶Table showing cost of infection by device type.
A total of 928 751.90 GBP was spent on CDI—an average cost of 30 958.40 GBP per infection. Following the introduction of the ICP, the incidence of CDI reduced by 54%. The cost of the ICP was estimated from the cost of new materials used such as Chloro-prep© applicators and antibiotics, as well as the cost difference as a result of replacement of materials (antibiotic-coated vicryl in place of regular vicryl) (Table 6). On average, per penicillin-tolerant patient who was considered low risk for infection (which comprised the vast majority of our patient cohort), the cost of changes introduced in the ICP was ∼85.08 GBP. The cost for patients who were penicillin allergic and considered low risk was 89.63 GBP (due to administration of i.v. clarithromycin as opposed to flucloxacillin). For high-risk patients undergoing CDI, teicoplanin was administered along with gentamicin which cost 35.62 GBP, leading to an ICP cost of 115.80 GBP per high-risk patient (which accounted for ∼8% of our annual post-protocol cohort). Despite this, an estimated overall cost-reduction of 75 011.68 GBP per annum was still achieved in light of the lower overall infection rate in our post-protocol patient population.
Cost difference as a result of ICP
| Pre-protocol (GBP) | Post-protocol (GBP) | Difference | |
|---|---|---|---|
| Sutures (x3) | 6.48 | 20.37 | 13.89 |
| Diathermy pen (x1) | – | 9.18 | 9.18 |
| Sterile gloves (+1) | – | 1.32 | 1.32 |
| Antibiotic costs | |||
| Low-risk Penicillin tolerant | – | 6.85 | 6.85 |
| Low-risk Penicillin allergic | – | 11.40 | 11.40 |
| High-risk | – | 37.57 | 37.57 |
| Chloro-prep© Applicator (x2) | – | 5.84 | 5.84 |
| MRSA swab and culture (x3) | – | 48.00 | 48.00 |
| Total difference in cost per patient post-protocola | 85.08 | ||
#Breakdown of costs incurred as a result of introduction of the infection-control protocol per patient.
aFor Penicillin tolerant, low-risk patients. Italics represent cost incurred for patients with penicillin allergy and high procedure risk patients.
Microbiology
The results of blood and wound cultures are shown in Figure 2.
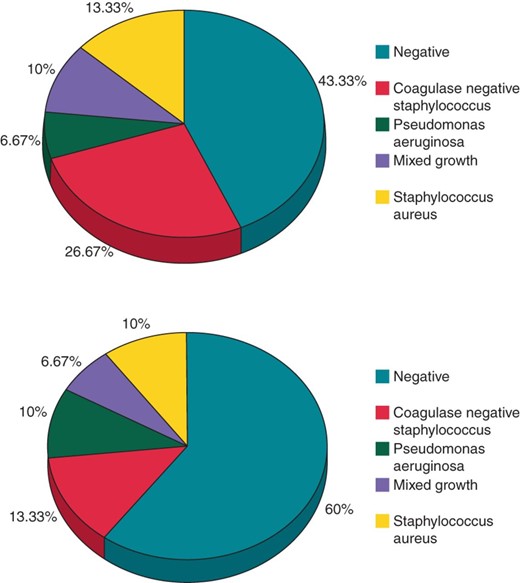
Microbiology culture results—Pie-charts showing microbiology results in wound (top) and blood (bottom) culture results for all CDIs.
Discussion
Prevention of CDI is of paramount importance in the current era of increasing device implantation and infection rates. Prior to the introduction of the ICP, there were no fixed guidelines within our institution for perioperative practice to reduce CDI. We demonstrated that the rigorous implementation of simple, evidence-based and cost-effective measures significantly reduced the risk of CDI.
While evidence exists that the risk of SSI within a year of implantation is significantly higher than the risk of infection after a year for both first implantations and replacement procedures,22,23 there is a lack of data regarding SSI. Furthermore, it has been suggested that CDI is mainly the result of local contamination during implantation.24
Evidence for changes introduced in the infection control protocol
Methicillin-resistant Staphylococcus Aureus screening
Guidelines for the control and prevention of MRSA in health care facilities25 state that high-risk patients should be screened for MRSA. Prior to any planned invasive procedure, the risk of infection should be minimized through topical and systemic decolonization.
Antibiotic prophylaxis
A meta-analysis of antibiotic prophylaxis prior to PPM implantation trials compared antibiotic therapy with a ‘control’ group without antimicrobial prophylaxis.18 There was a statistically significant protective effect from infections when patients received antibiotic prophylaxis. Recently, two large randomized trials also support prophylactic antibiotic use prior to cardiac device implantation.20,26
Skin preparation
Patients' skin is a major source of pathogens causing SSI. Preoperative cleansing with chlorhexidine-alcohol has been shown to be superior to iodine cleansing as chlorhexidine is not inactivated by blood or serum.27 The application of chlorhexidine-alcohol reduced SSI risk by 41% compared with povidone-iodine.28
Hair removal
The Centre for Disease Control guidelines19 state that hair should be removed with electrical clippers. Micro-abrasions of the skin caused by shaving promote local multiplication of bacteria.
Glycaemic control
Diabetes mellitus has been identified as a predictor of CDI.22 In addition, in patients undergoing cardiac surgery, glucose levels >11.1 mmol/L in the immediate postoperative period were associated with increasing SSI risk.29
Antibiotic-coated sutures
The superior bactericidal effect of triclosan-coated vicryl sutures in reducing SSI has been demonstrated in in-vitro and in-vivo studies.30,31
Surgical technique and diathermy
Haematoma formation is a risk factor for CDI26 and can be avoided by meticulous cautery of bleeding sites. The use of higher diathermy energy is also considered to be bactericidal.
Cardiac procedures
All procedures were performed in a cardiac catheterization laboratory by senior operators. All patients were reviewed on the day of the procedure or the day after. Routine follow-up was at 6 weeks, 6 months, and 1 year.
Reduction in infection in complex devices
In this study, the composite infection rate of ICD and CRT-D devices reduced from 1.8 to 0.77% (P < 0.05). Previous investigations of CDI have typically combined PPMs and ICDs. Data from this study and others32 indicate that there are significant differences in the rates of PPM and ICD infection and that separate analyses, based on device type, should be performed when investigating CDI.
Cardiac resynchronization therapy (CRT) implantation has been shown to be an independent predictor of infection.32 It is likely that the increased procedural complexity and time associated with CRT-D and ICD device implantation along with the increased numbers of leads and patient co-morbidity contribute to increased infection rates.
Risk factors for infection
The mechanisms responsible for prompting the dramatic increase in the number of CDI have remained largely undefined until recently. Small case-controlled studies have identified diabetes mellitus, renal dysfunction, a generator change procedure, corticosteroid, and anticoagulant use as being associated with an increased risk of CDI.25,32,33 Recent manipulation of the device is the most clearly identified and causal risk factor. Operator experience has also been identified as playing a role in the development of CDI.34
In the PEOPLE study,20 a prospective study involving over 6300 patients, the presence of a temporary pacing wire at implant, fever 24 h prior to implantation, and early re-intervention were the strongest predictors for future infections. The importance of re-interventions and device replacement is highlighted in the current era of increased safety alerts and device advisories. The risk of major complications from recalled ICD devices requiring a further procedure was 5.8%, including two deaths after system extraction for CDI.35
In this study, risk factor analysis revealed no significant differences between the control and study populations that might account for a spurious reduction in infection rates.
In fact the higher incidence of diabetes, anticoagulation, and renal dysfunction along with a longer mean procedure time in the prospective cohort of patients may have, if anything conferred, a higher risk of infection in this group. The difference in the incidence of these risk factors between groups may in part be explained by an increasing number of complex devices being implanted in the post-protocol group. Patients undergoing complex device implantation are more likely to have co-morbidities such as diabetes and renal disease as well as longer procedure times.
Economic implications
Data regarding the economic implications of CDI remain lacking as acknowledged in the recent American Heart Association/Heart Rhythm Society guidelines.36 This study is one of very few that goes some way to address this issue. We found the estimated cost for a patient with CDI to be 30 958.40 GBP. In a recent European study, the cost of a PPM infection was 7091 euros.37 However, this cost was based on only seven infections. Our figures correlate well with two recent estimates of the average cost of CDI in the USA. These studies looked at all patients undergoing cardiac device implant retrospectively, and analysed costs based on the number of CDI encountered by device type. The estimated cost of CDI from these studies is 35 000 USD (PPM 25 000 USD and ICD 50 000 USD),38 and 30 000 USD (PPM 28 676 USD and ICD or CRT-D 53 349 USD)39 respectively.
Microbiology
Consistent with our findings (Figure 2), it is well established that Staphylococccus species represent the most common pathogen isolated in cases of CDI.40Staphylococcus has been found in 69–92% of CDI patients with up to half growing MRSA.41 Less frequently encountered pathogens include other gram-positive aerobes (Enterococcus and Propionobacter acnes), gram-negative aerobes (e.g. Pseudomonas or Proteus sp.), and less common fungi (e.g. candida) ormycobacteria.3
Current guidelines recommend prophylactic administration of antibiotics that possess in vitro activity against staphylococci.38 We advocate a two-tier strategy whereby patients at highest risk of infection are prophylactically given teicoplanin, an antibiotic with activity against MRSA, while others receive a beta-lactam agent such as flucloxacillin. Both groups should also receive gentamicin for gram-negative cover.
The high percentage of culture-negative CDI (43%) is in keeping with other studies,16,42 though this may in part be due to samples being taken after antibiotic therapy had been initiated at other institutions.
Similarly in 60% of CDI patients, no microbes could be grown from tissue culture. Antibiotics had been initiated in the majority of patients prior to system explant and it can also be difficult to interpret pocket and lead cultures due to potential contamination of bacteria from the extraction processitself.43
Limitations
This work compares a prospective cohort of patients to those identified by retrospective analysis and thus bears the inherent limitations of such studies. However, bias was minimized by collecting data from consecutive patients undergoing a procedure in both the control and prospective groups. Though unlikely, it is possible that the incidence of CDI in the retrospective population was underestimated. However, if this were the case it would only serve to increase the extent of the reduction in CDI that we demonstrated. It is also important to note that more complex devices were being implanted and procedure times were longer in the study group. Nevertheless, an overall reduction in device infections with the ICP is still evident despite this increase in procedure time over the two study periods.
We adopted the definitions of SSI as proposed by the CDC but despite the inclusion of all cases which corresponded to these definitions, the infection rate may have been underestimated in the prospective cohort of patients, though we believe this is unlikely.
There is variation in device generator size, lead dimension, material, and design between different manufacturers, which may have changed with time. This variation in surface area of generator and lead material could affect patients' inflammatory response to the device, adherence properties of bacteria and thus the risk of CDI. A statistical examination into whether there was an association of these properties and the risk of CDI was beyond the scope of this study.
Given that the new protocol dictated several changes in practice, we are unable to determine whether the reduction in CDI was driven primarily by a single intervention and if so which strategy was the most effective. Nevertheless, we believe that the protocol consists of several simple and cost-effective measures, which can easily be introduced in any implanting centre.
The cost of CDI in our study is likely to represent a conservative estimate as the cost of investigations such as cardiac and non-cardiac imaging, blood tests, and the treatment of other infectious complications was not included in our analysis. Furthermore, the proposed annual cost reduction, observed as a result of implementation of the ICP, is difficult to accurately predict as we can only estimate the proportion of penicillin allergic and, in particular, high-risk patients (of which there were 2% who had a re-intervention and 7% who had a temporary wire) who will undergo CDI each year. In addition, several patients were transferred to our hospital having been admitted to local hospitals initially. In addition, we have only included costs incurred for treatment following admission to our centre as further analysis was beyond the scope of this study.
Finally, in total there were 30 patients with infections within a year of a device implant or device-related procedure (24 in the control group and 6 in the study group). Drawing definitive conclusions from the analysis of this small group of infected patients should be made with caution.
Conclusion
Using a series of simple and cost-effective infection-control measures, we demonstrated a significant reduction in CDI occurring within a year and leading to a substantial health care cost saving. In keeping with previous reports, Staphylococcus sp. is the most commonly grown organism in this group of patients. Implementation of similar protocols in other centres implanting cardiac devices may reproduce similar reductions in infections and should be considered. Further research into the prevention of this costly and potentially fatal complication is still needed.
Funding
This work was supported by the Department of Health's NIHR Biomedical Research Centres funding scheme that provided a proportion of funding to UCLH/UCL. All researchers were independent of funders.
Conflict of interest: none declared.
